Performance of Charter Schools in Wake County
In 2017-18, there were 22 charter schools in Wake County. It’s hard to compare their performance with that of WCPSS district schools for several reasons. For one thing, the district has so many more schools (183), with wide variations in school populations, resources, and programs. For another, both traditional public schools (TPS) and charter schools must report many statistics. They might excel in one area while falling short in another. School Performance Grades (SPGs) are summaries that provide a clue, and most charters and TPS receive these annually. But some education experts believe that North Carolina’s SPGs are too heavily weighted toward test scores, and many argue that growth statistics are more accurate than performance statistics. (More on that later.)
When assessing the effectiveness of Wake’s charter schools, one can at least say that Wake charters had better performance grades than the charter schools in Durham County for the past few years. Of Durham’s 13 charter schools in the 2016-17 school year, 5 (38%) had SPGs of D or F. This accounting excludes the two virtual charter schools because they really shouldn’t be included in Durham’s stats–their students can live anywhere in NC. But they both seem to earn Ds every year.
Wake had only 18 charter schools in 2016-17. Only one earned a D (PreEminent Charter of Raleigh); there were no Fs. As the Raleigh News & Observer reported, 14 Wake charter schools (77%) received either an A-plus, an A, or a B performance grade that year. By contrast, only half of the county’s TPS received similar SPGs for the same academic year. But the News & Observer rightly points out the extremely small percentage of low-income students at those high-performing charter schools (9% or fewer). They add, “Of the seven charter schools that got a B, none had an enrollment that was higher than 24 percent low-income.”
Of the five Wake charter schools that received a performance grade of A+, the one with the highest percentage of low-income students had only 9% (Triangle Math and Science Academy). The tiny fractions of Wake County’s charter school populations that are low-income students are another reason why it’s not very productive to compare charters’ performance with that of TPS. Many critics of charter schools nationwide contend that charters siphon off the better-resourced students and cram the local district schools with high-poverty students. Charter operators aren’t allowed to be selective about family income, according to NC state law, but they still end up with very few low-income students by the simple fact that they don’t provide transportation or meals.
PreEminent Charter received a D grade for the third consecutive year. The school’s 2013-14 test scores earned it a “Falls Far Below Standard” rating in every academic category of the Charter School Performance Framework except for two (one of which was a federally mandated “annual measurable objective,” and the other of which was a “Does Not Meet Standard,” slightly better than “Falls Far Below,” in Reading).
Only one charter school in Wake received a grade of F for the 2015-16 school year, Hope Charter Leadership Academy, a K-8 school in Raleigh. Hope’s small student body (117 students) was 93% low-income. Nobody was trying to turn a quick buck by preying on this small population of vulnerable, resource-strapped families, nor was anyone spending gobs of state money profligately at Hope Charter. By the end of the 2016-17 school year, Hope had managed to improve student performance on EoG tests dramatically, earning a C grade.
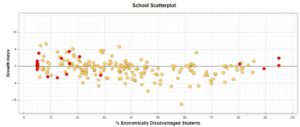
SAS EVAAS is the statistical methodology and software that North Carolina uses to analyze and report on public-school and charter-school performance statewide. EVAAS stands for Education Value-Added Assessment System. The NC Dept. of Public Instruction’s EVAAS website provides scatter plot charts of public and charter schools’ “growth index,” correlating one measure of school performance with the percentage of low-income students at each school:

Eighteen of Wake’s charters are shown in red on this chart, which displays data from 2016-17. If you zoom in, you can see that 6 charters are clustered around the 5% low-income mark. Wake Forest Charter Academy had the highest growth index of Wake’s charter schools (6.92). Cardinal Charter had the worst growth measure (-5.46), slightly better than The Exploris School (-5.01). However, it’s worth noting that Exploris had the highest possible SPG (A+NG), and Cardinal received a B.
The scatter plot does not reflect school performance grades; it instead shows each school’s proximity to its statistically derived “growth standard.” It shows that half of Wake’s charter schools have pretty impressive growth statistics, and that their student populations are on the wealthy side. SAS claims that EVAAS, which measures growth, is a more equitable and accurate measurement of a school’s effectiveness in educating all students: “Achievement provides a snapshot of a single point in time, essentially when a student took a test. It is often defined by the score that a student received on a single day, under that set of conditions.” But growth refers to progress (or change, because growth can be negative) over a period of time. While achievement is affected by factors that are out of the schools’ control, such as demographic and environmental factors, EVAAS excludes factors that educators can’t influence. For example, the system typically finds little correlation between student growth and socioeconomic status. Other performance measurements find a very strong negative correlation between poverty and student achievement.
Wake’s charters mostly have good or excellent growth indices. Even Central Wake Charter High School, with a whopping 89.47% of the student body classified as low-income, had a growth index of -1.17 in early 2018 (represented by the red dot at the far right of the chart). That’s close to average, 0, which is indicated by a line in the chart and means that on average, students met the growth standard for that school. You can easily see that many Wake TPS fell below it in 2017. Compare their growth index with that of Cardinal Charter (-5.46), which reports a 12.48% low-income population.
Among Wake’s TPS, Holly Ridge Middle School has the worst growth index among schools with fewer than 30% low-income students. Wakefield Middle, in the northern part of the county, had a cringeworthy -7.78 growth index with only 21.99% low-income (and it earned a C).
Central Wake is a small dropout-prevention school, with about 75 students. It opened too late to report any test scores or receive a school performance grade in 2016-17. Has this school placed students on a firmer footing, and are their test scores moving in the right direction? Of the four of Wake’s charters that reported 80% or more low-income students, all had a growth index of at least 0.97, except for Central Wake.
It’s worth considering the following lingering questions:
- Whether for-profit charter management organizations (CMOs) are as effective as smaller or mom-and-pop shops.
- Whether the “growth” statistic is as accurate a measure as the SPG.
- Whether charters are a better option for low-income or at-risk students. By and large, TPS have not served these kids well.
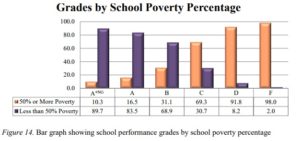
Poverty really does seem to affect school performance, but the EVAAS “growth” measurement does not take it into account. Look at this chart from the 2016-17 NC DPI report “Performance and Growth of North Carolina Public Schools,” for example:

Poverty matters, Folks…
Finally, perhaps the most important question of all: are charter schools doing a better job of educating low-income students, who perform worse on average in localities all over the US? In Wake, the answer appears to be Yes, but in Durham, that’s a hard case to make.

